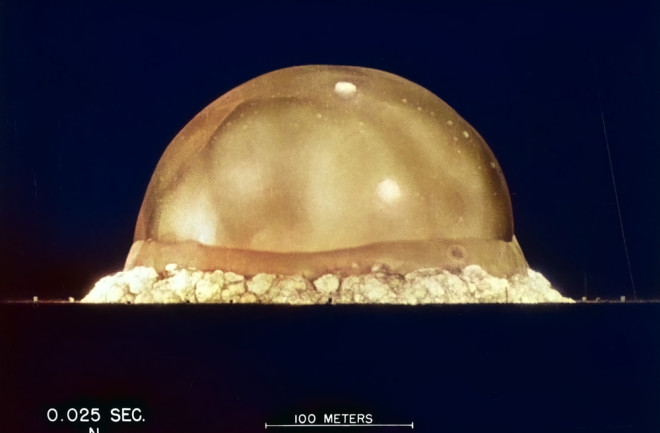
The Trinity Nuclear Test on 16 July 1945 is a key incident in the blockbuster Oppenheimer movie and in the history of humankind. Many scientists think it marks the beginning of the Anthropocene, a new geological era characterized by humanity’s influence on the Earth. That’s because Trinity’s radioactive fallout will forever appear in the geological record, creating a unique signature of human activity that can be precisely dated.
But there’s a problem. In 1945, radioactive monitoring techniques were in their infancy so there are few direct measurements of fallout beyond the test site. What’s more, weather patterns were also less well understood so the spread of fallout could not be easily determined.
As a result, nobody really knows how widely Trinity’s fallout spread across the U.S. or indeed, how the fallout dispersed from other atmospheric nuclear tests on the U.S. mainland.
Nuclear Mystery
Today, that changes thanks to the work of Sébastien Philippe at Princeton University and colleagues. This team have used a state-of-the art weather simulation for the 5 days after each nuclear test to simulate how the fallout would have dispersed.
The result is the highest resolution estimate ever made of the spread of radioactive fallout across the U.S. It marks the start of the Anthropocene with extraordinary precision and it throws up some significant surprises. Some parts of the U.S. are known to have received high levels of fallout and the new work is consistent with this. But the research also reveals some parts of the US that received significant fallout without anybody realizing.
The findings “provide an opportunity for re-evaluating the public health and environmental implications from atmospheric nuclear testing,” say Philippe and co.
Between 1945 and 1962, the U.S. conducted 94 atmospheric nuclear tests that generated yields of up to 74 kilotons of TNT. (Seven other tests were damp squibs.) 93 of these tests took place in Nevada but the first, the Trinity test in the Oppenheimer film, took place in New Mexico.
The U.S. government recorded various details for each test, including the time and location, the yield of the explosion and its height above the ground plus the size of the mushroom cloud it produced. After all these tests, nuclear scientists have a good idea of the radioactive fission products created in each explosion and the size of the particulates.
Philippe and co-fed this data into a computer model that simulates the way particles disperse in the atmosphere. And they fed this in turn into a weather model.
The model in question was developed by the European Centre for Medium Range Weather Forecasting based in the UK, which has long attempted to model 20th century weather and climate using 21st century computational techniques. Philippe and co use the latest incarnation of the model called ERA5, which simulates the weather from 1940 onwards based on whatever meteorological data was gathered at the time.
The main outcome of the team’s work is a high-resolution map showing the density of fission products deposited across the continental U.S. from all 94 atmospheric tests. Philippe and co say the map are significantly more detailed than previous studies, showing, for example, the radiation corridors and shadows created by the Rocky Mountains.
Because it was the first and most significant explosion, the team model the Trinity test in more detail than the rest. They show how the radiation cloud spread across the U.S. over several days and in particular how it reached a remote body of water in Canada, called Lake Crawford, on 20 July.
Gold Standard
That’s significant because an international group of scientists called the Anthropocene Working Group recently chose Lake Crawford as the gold standard from which measurements of the Anthropocene will be taken. The lake is a good choice because it is relatively calm, allowing dust from the atmosphere to settle at the bottom in well-defined layers that provide a record of human activity over many years.
This group has also decided that the Anthropocene should start in 1950 when the effects of human activity on the Earth began to accelerate.
But if measurements of radioactive particles from atmospheric explosions are also a measure of the start of the Anthropocene, Philippe and co’s work show that this must be dated from that Friday 20 July onwards. That raises the possibility of rethinking what the precise start date of the Anthropocene should be.
The new work also has implications for the way compensation is paid to people who suffered from radiation exposure. The U.S Radiation Exposure Compensation Act (RECA) provides monetary compensation for this in various counties and tribal lands.
But the new work reveals places that are not covered by the Act but that also received high exposure. “There are locations in New Mexico, and in other parts of the United States, including Utah, Nevada, Wyoming, Colorado, Arizona, and Idaho, where radionuclide deposition reached levels larger than those we estimate in some counties covered by RECA,” say the researchers.
That’s interesting work with important implications. And it has been released in conjunction with the Oppenheimer movie, presumably to give it maximum exposure, and rightly so.
Ref: Fallout from U.S. atmospheric nuclear tests in New Mexico and Nevada (1945-1962) : arxiv.org/abs/2307.11040

