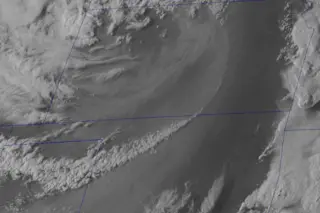
As the center of a low pressure system spun over the northwestern corner of Kansas, high winds swept a large dust front across a broad swath of the Central Plains. For a dramatic animation, please click on the image. (Source: Satellite Blog of the Cooperative Institute for Meteorological Satellite Studies.) The same slow-moving low pressure system implicated in the South's severe thunderstorms and deadly tornadoes also kicked up areas of blowing dust across the Central Plains. The "blowing dust front" was so large and distinct that it was visible to sensors on satellites. The image above was acquired by the GOES-13 satellite on Sunday. Kansas dominates the top of half, and you can spot the center of the low pressure system's circulation in the state's northwestern corner. The blowing dust front, as the Satellite Blog of the Cooperative Institute for Meteorological Satellite Studies calls it in their excellent post about the event, sweeps across the middle of the state. (To watch an animation of the dust front blowing east across the state, click on the image.)
An infrared image from the GOES-13 satellite on Sunday. The colors correspond to temperature, with dark red, black, gray and violet indicative of the coldest temperatures — and therefore the highest thunderstorm clouds. The image also includes storm reports from the Storm Prediction Center. Click on the image for an animation. (Source: Cooperative Institute for Meteorological Satellite Studies.) The low pressure system was associated with disturbances that provided the lift needed for warm moist air to rise high into the atmosphere and form supercell thunderstorms, as well as the shear that contributes to the formation of tornadoes. The image above, from the GOES-13 satellite, shows the development of massive thunderstorms ahead of the dust front. The colors are indicative of the cloud-top temperatures. As air masses in the thunderstorms rose high into the atmosphere, their tops cooled dramatically — to as low as -81º C, according to the CIMSS. The dark reds, black, gray and a bit of violet in the image are associated with severe thunderstorms that produced hail, damaging winds, and tornadoes. Look for the pink T's in the image — these mark the location of some of the tornadoes spawned by the thunderstorms. Also, click on the image for an animation. (You may have to wait for it to load.) In the animation, watch for other tornado detections, as well as severe wind gusts (mapped with light blue G's, and hail, indicated by yellow A's). Before I finish I just want to thank the folks at the Cooperative Institute for Meteorological Satellite Studies. Both of these images are from their awesome Satellite Blog. I check in there every day, and I have to say that ImaGeo wouldn't be the same without their incredible imagery. I'm very grateful.