California Drought, Midwest Chill Tied to Climate Change?

ImaGeo iconImaGeo
By Tom Yulsman
Apr 17, 2014 8:08 PMNov 20, 2019 1:33 AM
VIIRS_DNB__REF_20140416_0740.png

Newsletter

Sign up for our email newsletter for the latest science news
 

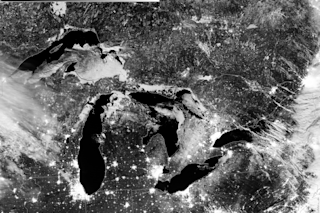
The Great Lakes on the night of April 16, 2014, as seen by the VIIRS instrument on the Suomi NPP satellite. Ice is still present on all the Great Lakes except Lake Ontario. (Source: CIMSS Satellite Blog) Here we are in mid-April and the Midwest is experiencing yet another unusual wintry blast. No wonder there's still quite a lot of ice in the Great Lakes, as you can see in the remarkable image above, captured under a full moon at night by the Suomi NPP satellite. Click on it to enlarge it. The ice is particularly evident in Lake Superior at upper left. Meanwhile, warm and dry conditions continue in California. New NASA-funded research led by Simon Wang at Utah State University, suggests that this pattern — frigid cold in the North American mid-section and dry in California — is connected to global warming. In this post, I'll explain the connections identified in the research, which was published in Geophysical Research Letters. But before I get to the details, I do want to emphasize the caveats: This is just one study, and it's in an area of cutting edge research. More about the caveats toward the end, but first... The proximate cause of the cold/dry dichotomy is a "dipole" pattern of atmospheric pressure. It consists of low a pressure trough stretching from northern Canada down into the Midwest, which allows Arctic air to spill south; and a high pressure ridge centered in the Gulf of Alaska and stretching down the Pacific coast to California. This ridge tends to block weather systems from delivering desperately needed moisture to California. You can see the pattern here:

A map showing how geopotential heights varied from the norm on April 14. (Source: NOAA/ESRL) The colors in this map correspond to something known as "geopotential height anomalies." I explained this phenomenon in some detail earlier this year in this post. Suffice it to say that warmer colors correspond to higher atmospheric pressure, warmer temperature, and dry conditions in California; cooler colors correspond to lower pressure and colder temperatures. Note that blob of blue and purple over North America's midsection, and the yellow and green blob to the west. This is the dipole pattern, and it has been remarkably persistent. In their research, the Utah State scientists analyzed the historical data and found that this dipole pattern has actually been intensifying since the late 1970s. To figure out what's going on, they used a new global climate model. The scientists found that with natural variation alone, the dipole pattern should have actually been weakening since the late 1970s. But when emissions of greenhouse gases and their effect on the climate system were added into the computer simulations, the dipole did indeed seem to intensify. (Click here to see an infographic depicting these findings.) There is also an intriguing link to El Niño, the much ballyhooed phenomenon tied to sea surface conditions in the equatorial Pacific ocean that causes climatic effects around the world. The researchers found that the dipole pattern tends to turn up one year before an El Niño. Here's how the scientists put it in their paper:

One striking result of the diagnosis is that the dipole corresponds strongly with circulation features of the year prior to an El Niño, and also appears to be triggered by a wind and SST pattern that has been identified as a potential long-lead precursor of El Niño.

By "SST" they mean sea surface temperatures. Based on observations of SSTs in the Pacific ocean, as well as wind patterns, the National Oceanic and Atmospheric Administration pegs the odds of an El Niño developing later this year at greater than 50 percent. And here is another possible link to global warming: In the computer modeling, dry conditions over California were seen to be connected to the precursor conditions of an El Niño only when the climate system was "forced" by the addition of greenhouse gases. The modeling also showed that continued climate change could make things worse: "It is important to note that the dipole is projected to intensify, which implies that the periodic and inevitable droughts California will experience will exhibit more severity," the researchers wrote. It's important once again to keep the caveats in mind. This is just one study. Also, possible connections between the kinds of patterns observed this winter and global warming is an area of research at the cutting edge of climate science. That means we don't have definitive answers yet. Further research will be needed to pin down what's going on, and the degree to which — if any — global warming is involved. For me, the research brings back the sage words of Wally Broecker, a renowned geoscientist at Columbia University's Earth Institute: "The climate system is an angry beast, and we're poking it with sticks." Have the Utah State researchers accurately identified a twitch in the climate dragon caused by our poking? Time will tell.

1 free article left
Want More? Get unlimited access for as low as $1.99/month

Already a subscriber?

Register or Log In

1 free articleSubscribe
Discover Magazine Logo
Want more?

Keep reading for as low as $1.99!

Subscribe

Already a subscriber?

Register or Log In

More From Discover
Recommendations From Our Store
Shop Now
Stay Curious
Join
Our List

Sign up for our weekly science updates.

 
Subscribe
To The Magazine

Save up to 40% off the cover price when you subscribe to Discover magazine.

Copyright © 2024 Kalmbach Media Co.